
Visualizing data can be a powerful tool in understanding complex information. With the help of chart builders, you have access to a diverse range of chart types and templates. This allows you to effortlessly create visually appealing and easily comprehensible charts that convey your data effectively.
Step 1

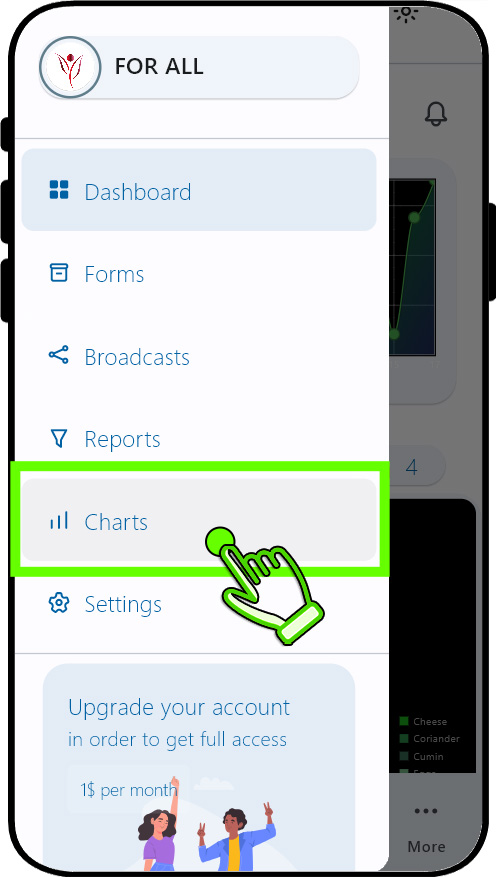

Tap the "Charts" option in sidebar menu.This will open "All Charts" page.
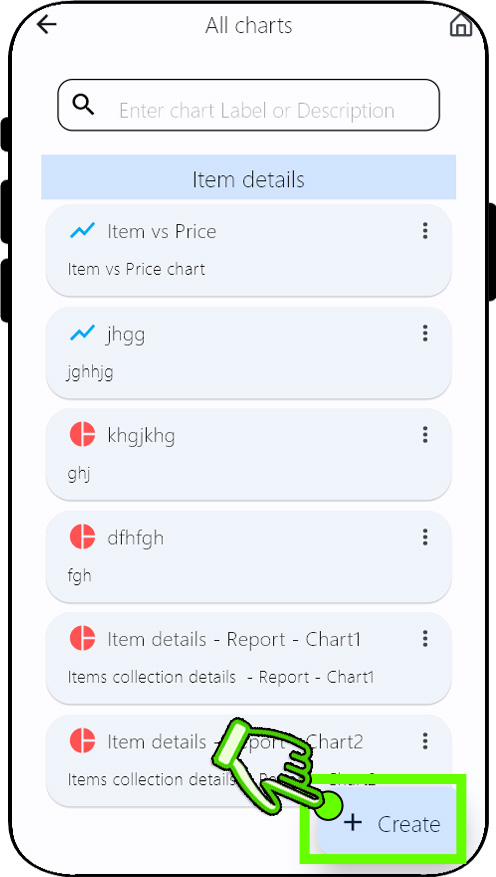
Tap the "+ Create" floating action button.This will open "Create chart" page.
Step 2


Step 3
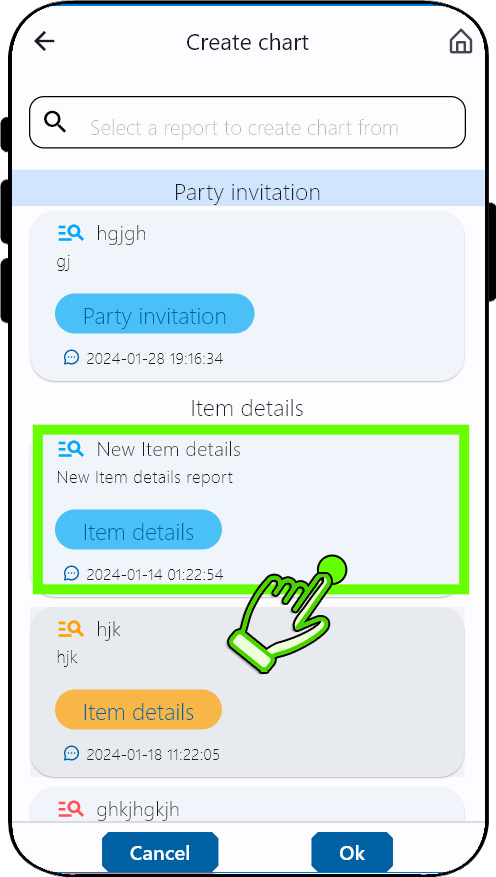
Select a report from the list and tap "OK" button.This will open "Chart builder" page.
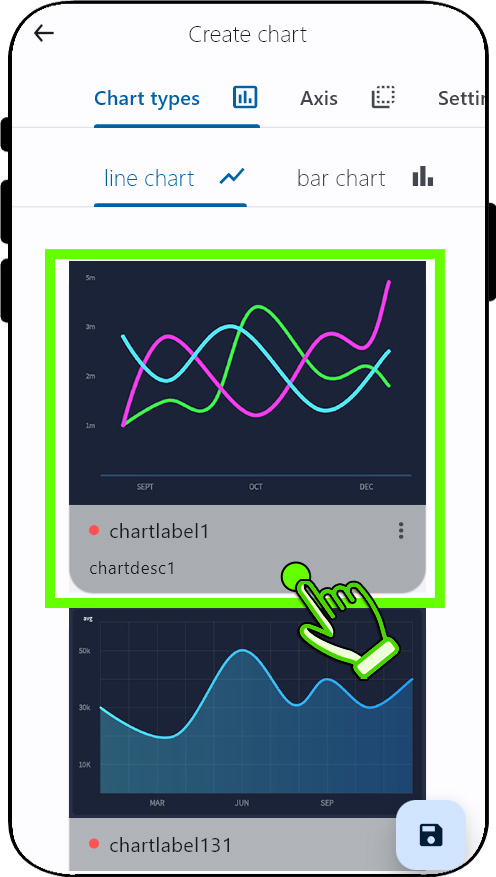
Select one of the templates from the chart types
Step 4
Step 5
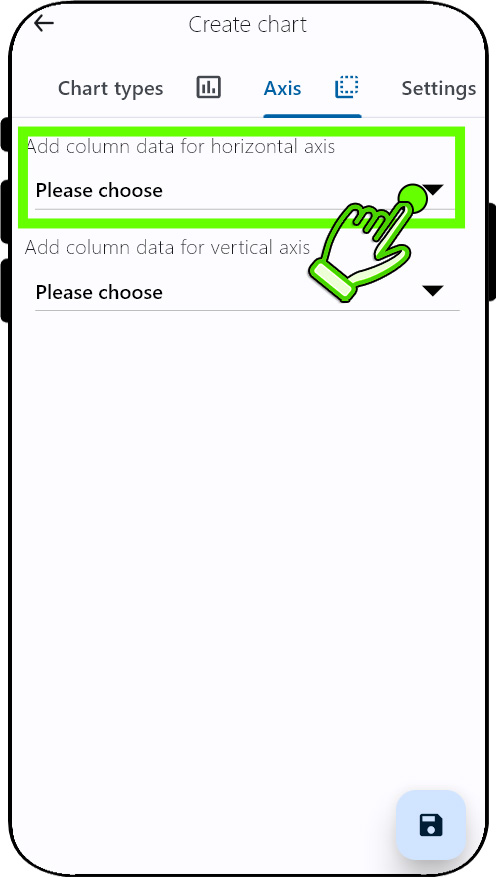
From the "Axis" tab, Select the field for horizontal and vertical axis.
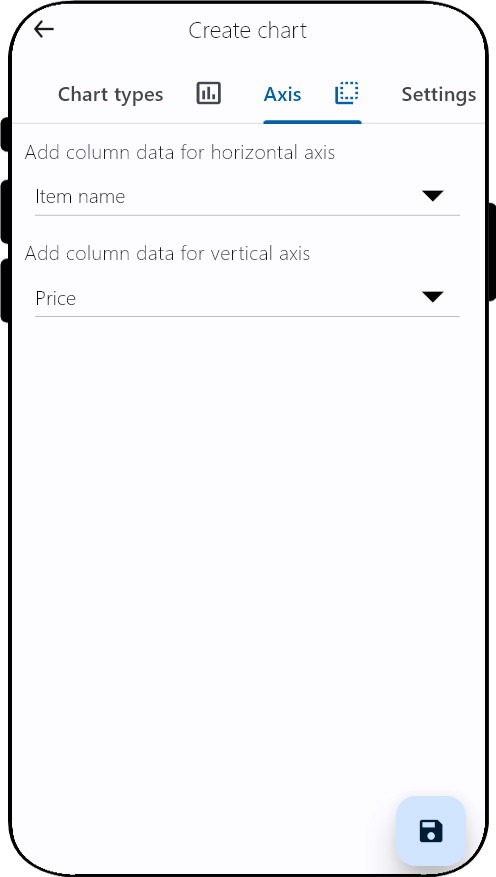
The look of "Axis" tab,After the field selection.
Step 6
Step 7
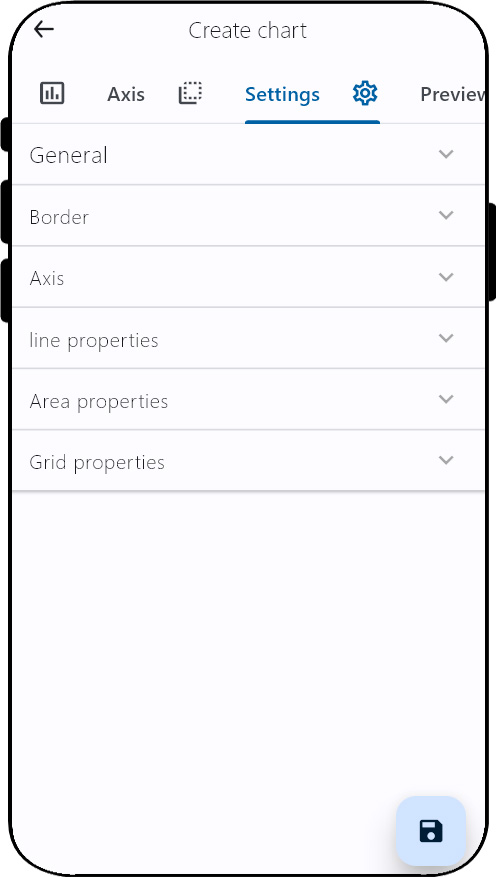
Different parameters for the charts can be customized from the "Settings" tab. Enhance the clarity of your data by tailoring every element of your chart, ensuring that information is effortlessly comprehensible.
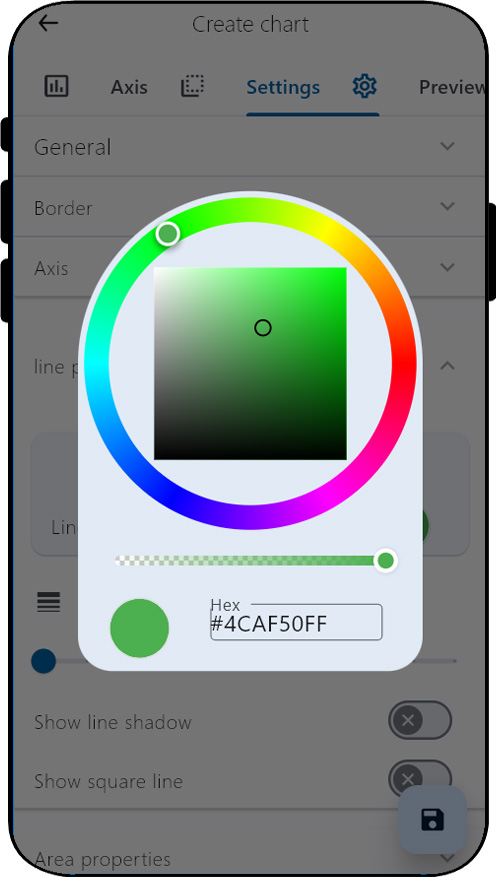
View of color selection dialog from the "Settings" tab
Step 8
Step 9
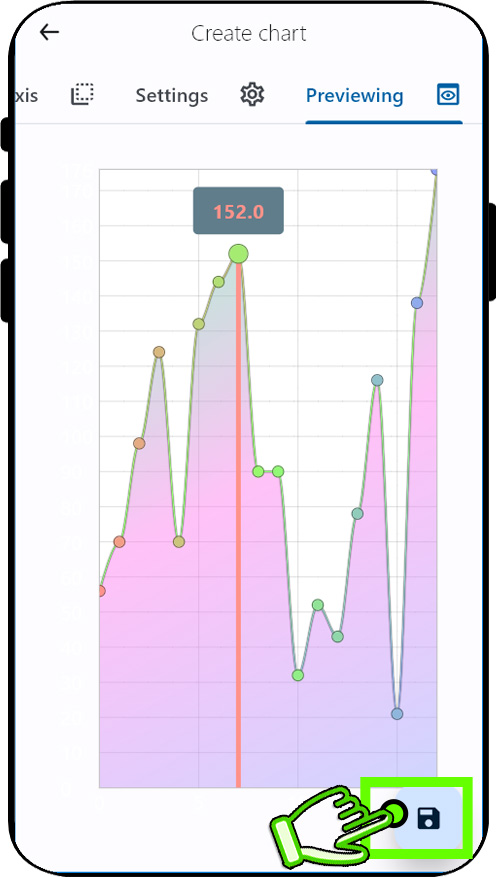
See the results from the preview tab, Tap "Save" floating action button to save the chart.
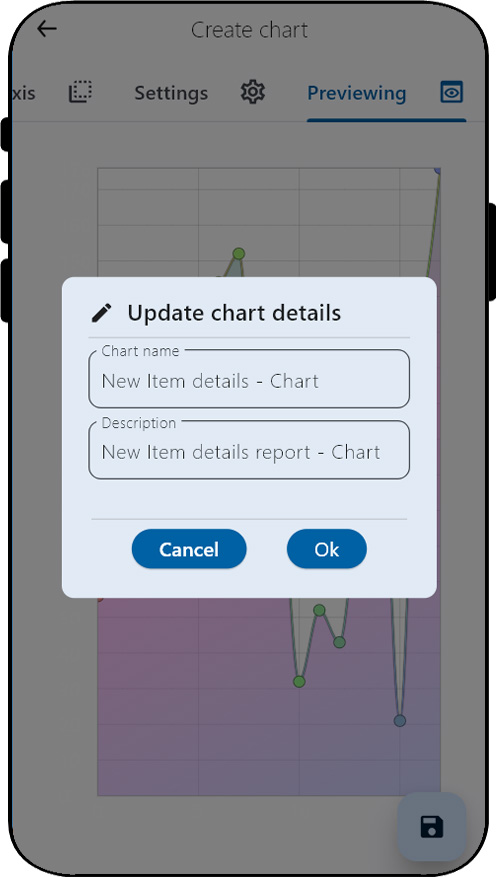
Enter the chart name and description and confirm by selecting the "ok" button. This will leads "Dashboard" page.
Step 10
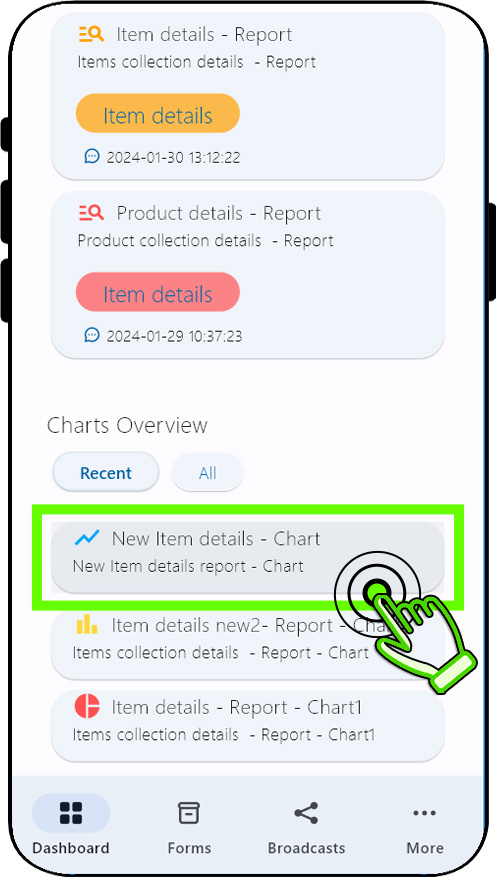
Observe the latest charts's addition to the "Chart overview" panel in the dashboard page.Double tapping the chart(card) will initiate the opening of the chart.
Step 11
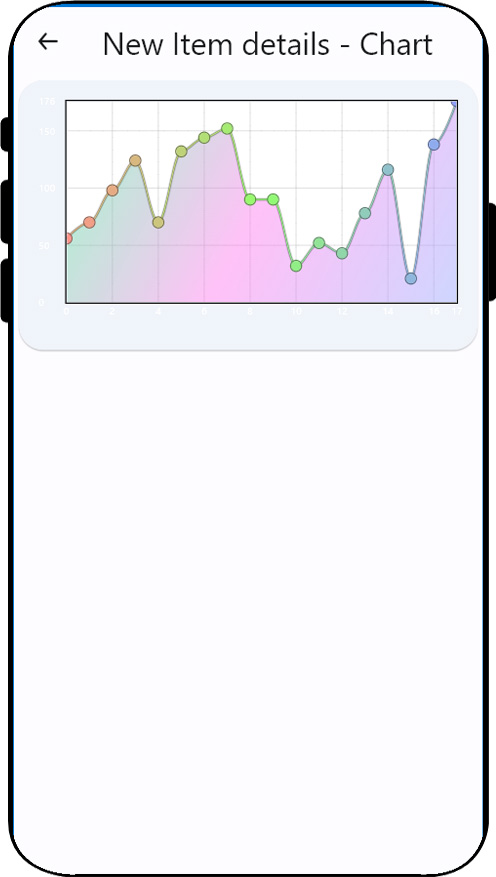
final chart page.
Step 12
Design attractive charts that are easily understandable.

Experience the magic of real-time synchronization with our charting feature. Each time the form data is
altered, our chart automatically adjusts itself, ensuring you always have the most accurate and up-to-date
information at your fingertips.